In my recent post I suggested that perhaps checking your stats every ten seconds wasn’t a good thing. Okay I actually told you lot to get back to work but it’s a small difference, right?
After I shared the post across various social networks I had some comments from people about some of the tips I suggested to get the most from your stats.
Although everyone and their lolcat knows how to see total page views not everyone knows how to get down into the real nitty gritty of stats and the really useful information that they contain.
I want to help you dig up these nuggets and exploit them to their full extent.
Remember you don’t want to over do how often you check your stats but get more from them each time you do.
What Statistics System Should I Use:
The first question you need to answer is “What Analytics system you are going to use to check your stats?” For any beginner there are really only two options to look at: Jetpack and Google Analytics.
Jetpack
Jetpack is provided by Automatic and includes several other functions and features that are very useful for a blog. It provides a built-in stats option that you can access on your WordPress site. However, it only has very basic statistics including page views, most viewed pages, where the traffic comes from, and what links you readers click.
These are very useful (as we’ll see soon bellow) but for more advance features you will need something a bit more robust.
Google Analytics
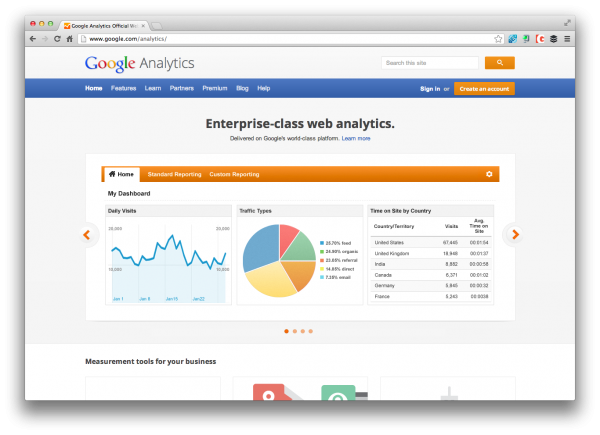
Google Analytics might as well be the de facto analytics service and as such this is the service I’ll spend time looking at. There are alternatives but most information out there is on Google Analytics and it integrates with their other software (like Adsense and Webmaster so it’s useful to stay within the ecosystem).
Unlike Jetpack you can’t access Google Analytics on your WordPress blog (unless you install the Google Analytics for WordPress plugin) and you will have to do some basic editing to your HTML files to install it.
For the rest of the article I’ll look at using Google Analytics (but I’ll mention if you can access these statistics in Jetpack as well) to look at stats that a beginner won’t be familiar with.

What Statistics Should I Keep An Eye On
Audience statistics
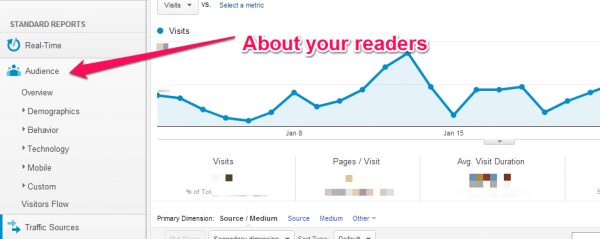
The first category we have in Google Analytic is Audience. In this section you can find about who and how is viewing your site.
Total Page Views
The most basic statistic. In general the larger the number…the better. There are two ways to increase this if it is low. More visitors, or visitors looking at more pages each visit. Now there are various ways to do that and each is worth a blog post on its own so I won’t bother listing them here. (Also In Jetpack)
Number of Visitors
When you combine this statistic with total page views you can start to deduce if people are looking at more content each time or just more people are visiting (or if there is negative trend as well!) This can help you act to better and know which area you need to work on, more visitors or looking at more material.
Percentage of New Visitors
Are you getting the same people turning up more often or new people each time? Are you just keeping the same readers, changing readers or growing? If your views are staying the same but you aren’t increasing your views then that means you are losing or not keeping viewers. Maybe you can act here.
Time Spent on Site
Time spent on site can be a way to measure engagement. Of course, if your site is based on pictures then it will probably be lower than a site which is more text based (if they are actually reading your stuff). If your readers are leaving quickly you probably want to increase this number.
Bounce Rate
The bounce rate reflects the instant impression of people when they reach your site. If they bounce then they leave your site without looking at any other content. Having a high figure here probably means your design sucks or you are getting your calls to action all wrong. You want to show people a follow on step and make sure they take it.
How are People Viewing your Site
Do you get more Apple or PC users? More desktop or Mobile users? The answer to should change what programs, how-tos and walk-throughs that you focus on as well as make you consider how to make your site more responsive.
Where in the world are your viewers based?
Are you a Brit who get’s a lot of American viewers? Maybe you should do yourself a favour/favor and change over to American spelling then (of course, maybe your readers could/couldn’t care less about the differences between American and British English. Or maybe they don’t notice)?Still you might want to start using a different affiliate network or place your prices in a different currency.
Traffic sources
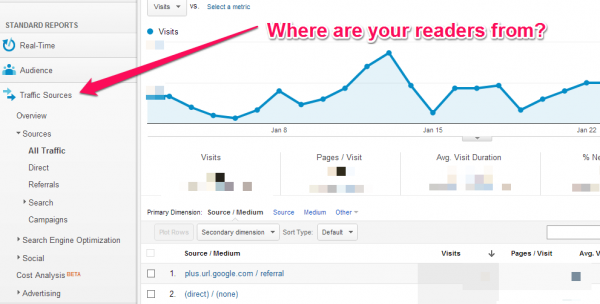
Traffic sources is all about how people get to your site. Are people being told to come to you from a link, are you Facebook “friends” visiting your site or are they finding you via Google. (you can even see where people go to once they first come to your site)
What Do People Search For?
This is commonly called “Keywords search” and you can get it on Jetpack as well as Google Analytics (where it is in the overview section of Traffic sources). This is a great way to find out how well you are doing with your SEO, and can also provide you with ideas for more blog posts when you see the other ways that people come to your blog.
Search and Social
These sections allow you to look individually at what people are looking at if they arrive at your site from a search engine or a social media update. Not only that but It will help you see where people go afterwards too.
Content
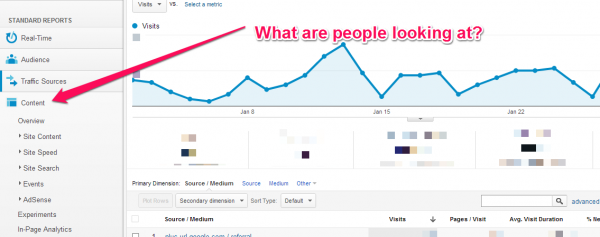
This section looks more specifically at where people arrive, where they go, and what pages they leave at. This is your chance to stop people from leaving your site as soon as they arrive.
Site speed
Perhaps the most overlooked section of Google Analytics is site speed. Site speed is vitally important as viewers are more likely to leave your site and less likely to buy, download or opt-in on a slow loading site but on top of that it affects your search engine ranking. Finding out what specific pages are loading slowly can help you boost your rank and put an end to site visitors leaving early.
Putting Your Stats into Action
These stats are all well and good and just looking at them in isolation from a surface level will help you work out a few useful things but let’s dive a little deeper and get even more value from your statistics.
Which Posts Do Well and Which Don’t
By identifying your successful and less successful posts you can pick up patterns in topics, writing and headlines that will help you get more traffic. You might notice some common features between your Best viewed sites and topics and be able to use that for your advantage.
When Do People Visit Your Site
Knowing when people visit your site can be very powerful. If you know that no one visits at the weekend then you might want to focus your promotion efforts during the week and use the weekend for writing more. If you know people visit at mid day you may want to target your post for that time.
Who Is Linking To You
Identifying individuals who link to you is very good but working out the group of people who are linking to you is even better. You may discover that you aren’t hitting your target market and decided to change your promotion strategy to match, or change your target market to fit who you are reaching.
Are Your Images/Videos Getting a Lot of Traffic
Maybe you want to change from focusing on texts posts and use some picture or video only posts. Likewise, if your images and videos aren’t working maybe you should change how you are using them.
Next step Level Two
This really is only the beginning of using statistics, we still haven’t looked at personalised statistics, setting goals, A/B split testing or Google’s real-time stats but with the tips above you have at least reached level one.
If you’ve only been using Jetpack (or haven’t used anything!) for your stats I suggest you get Google Analytics installed straight away, it is much more powerful and will help you a lot more.
What Stats do you always look at?

9 Comments