I love new ventures and I love new ventures that disrupt the norm.
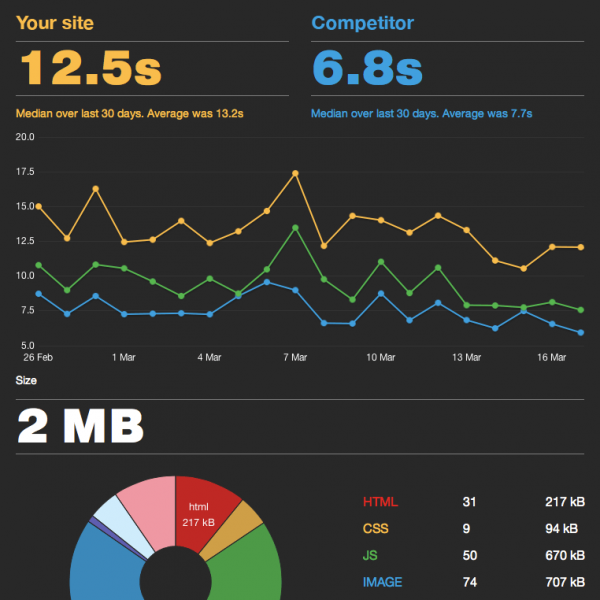
Enter in SpeedCurve a sexy new take on daunting website stats from UX designer Mark Zeman.
Mark’s seeking early Beta testers of his new app and shares why he started this in the first place:
Over the last few years I’ve run hundreds of tests on WebPagetest and wanted to see how the performance of my sites had improved over time. I also wanted to benchmark against competitors and make sure I was faster than them.
I’ve put together a simple service which takes the hassle out of running a private instance of WebPagetest and running multiple agents. I’ve focused on making it simple to get up and running and visualizing the results in a beautiful easy-to-use interface.
So why another stat aggregation app?
Well I’m sure we’re going to have to wait to find out as the Beta runs it’s course, but anything that makes data cleaner looking and easier to consume get’s the nod in my book — especially if we need to convey it to our client.
Here’s a screenshot of the current demo:
The power of UI/UX
With just a few clicks, you can segment various data points within the interface. If you’re monitoring multiple websites, this is a huge time saver and a great way to get a fourty-thousand foot view of your inbound traffic.
The waterfall screenshot view is also going to prove useful for optimizing those pesky call to action buttons.
I already signed up for the beta and I’m excited to dive in and play around. What about you? Useful for your business or using something similar? Let us know!


No Comments