No matter whether you are running a blog or another kind of website, online success is all about creating a relationship with your audience.
However, how do you do that? How do you establish a bond to an anonymous mass of individuals who happen to stop by your website?
Luckily, together with the means to build an online presence, technology has also provided us with a way to understand those who visit us there. I am, of course, talking about web analytics.
Analytics tools take a lot of the guesswork out of running a website. Without them, we would all be flying blind as to what is working on our site and what isn’t.
While there are a number of analytics tools for WordPress, probably the most widely used is Google Analytics. And for good reason. It’s a powerful tool and completely free to boot.
However, at the same time, it can be overwhelming, especially for non-veterans. To address this issue, in this Google Analytics tutorial for beginners we will have a detailed look at the popular analytics solution, how to get it on your WordPress site, and what to do once you have properly installed it.
So strap on your data nerd hat and let’s get to it.
What Is Google Analytics And Why Do You Need It?
For those completely new to the topic: Google Analytics is a web application that allows you to track traffic and traffic patterns on your website.
The data it collects allows website owners to answer such important questions as:
- How many visitors are coming to your site each month?
- Which websites and search engines are referring them?
- Which countries do they live in?
- What devices do your visitors use to access your site?
- Which browser are they using?
- What kind of content do your readers love and what do they find boring?
- Which of your marketing tactics is the most effective?
That’s powerful stuff. Knowing the answer to these questions allows you to optimize the user experience on your site, both from a marketing and a technical standpoint.
And that’s just the tip of the iceberg, Google Analytics actually allows you to go much deeper. And did I mention it’s free? I did? Ok then.
However, it also integrates with other free Google services such as Google Webmaster Tools, AdSense, and AdWords.
Convinced? Then let’s see how you can get Google Analytics onto your very own WordPress website.
Setting Up A Google Analytics Account
Not much to say here. Let’s dive right in. I’m ready when you are.
1. Create A Google Account
The first thing you need for a Google Analytics account is a Google account. If you already have one (e.g. if you have signed up to Gmail or YouTube), you can skip this step and use your existing account.
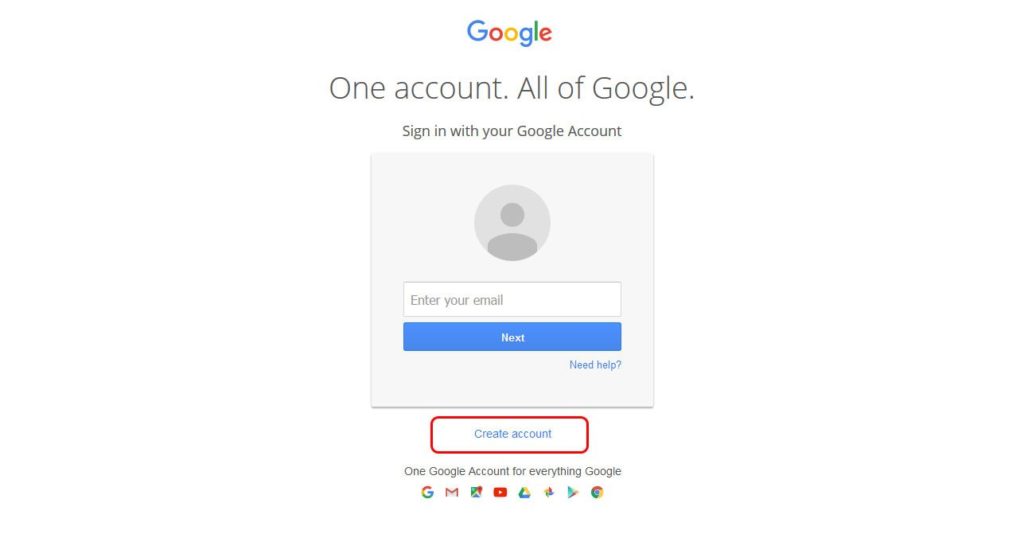
For everyone else (or those who, for some reason, want to set up an extra account for this), you first need to go to the Google Accounts page and click on Create account at the bottom.
After that, follow the instructions on screen. You should end up automatically logged in to your brand new Google account.
Important: You should set up your own account in all cases and not let someone else (like a web designer or SEO) do it for you. If they use their own account and you stop working with together, your entire data will leave with them and you will have to start from scratch.
If you have someone else deal with this part of your website, you can always grant access on a per-user basis (more on that below). However, you want to make sure you have full control over the account from the very beginning.
2. Sign Up To Google Analytics
Once you have created your new Google account (or found the credentials to your existing one), it’s time to head on over to the Google analytics page. An analytics account does not come automatically with a Google profile, you have to set it up manually. It’s easy though, no worries.
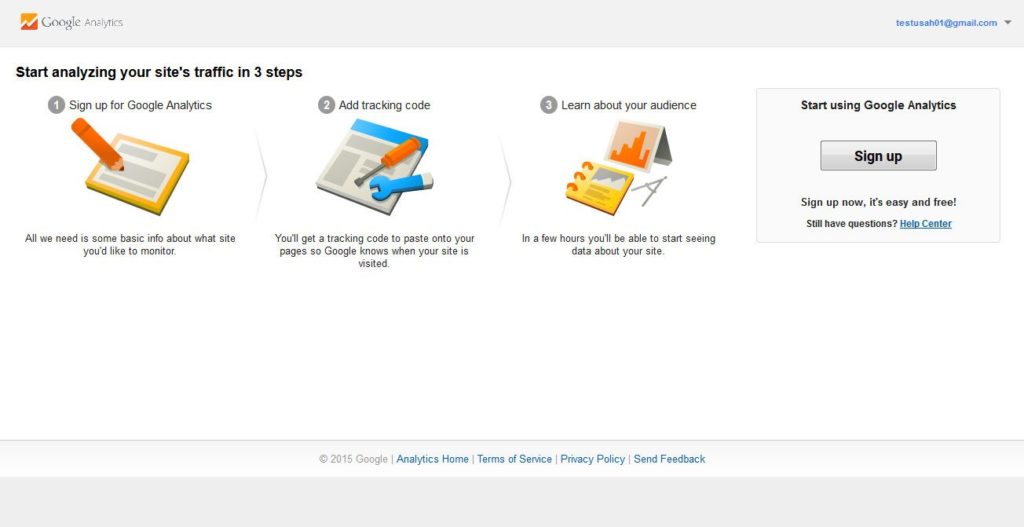
First you need to click on the button in the upper right corner.
This will lead you to the following page. Another click on Sign up starts the process.
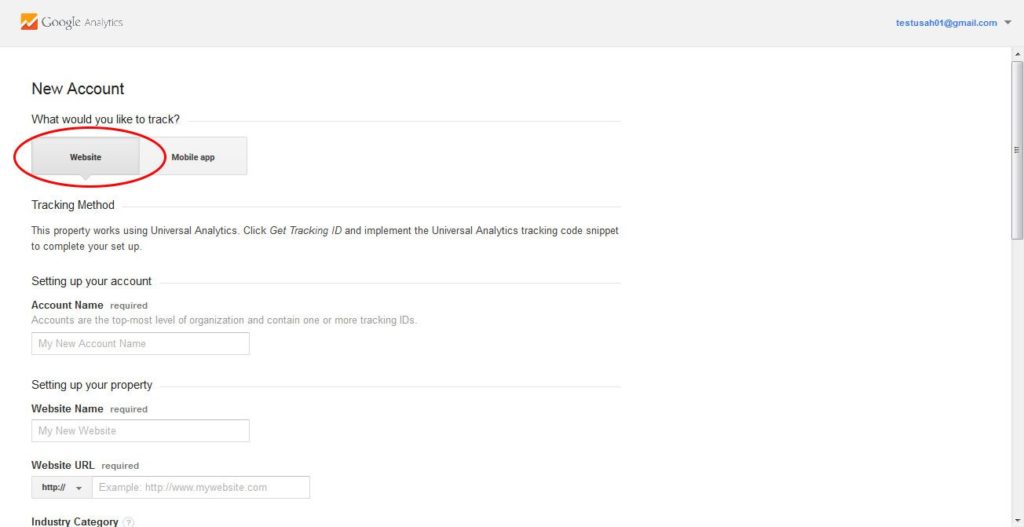
In the next page, make sure to choose Website and not Mobile app.
The rest is kind of self-explanatory. However, let’s make a quick detour at this point to explain some terminology and the hierarchy of Google Analytics.
- Google Account: This is the top-most level. It lets you sign into any Google service, including the Analytics suite.
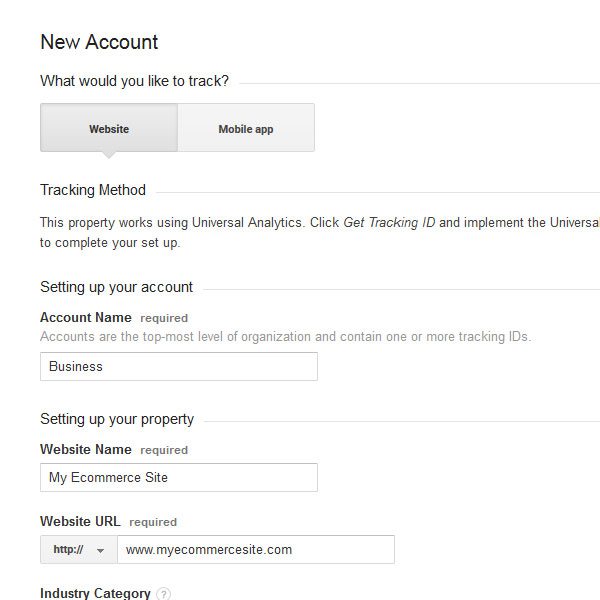
- Google Analytics Account: A Google account can have several Google Analytics accounts (a hundred to be exact). The latter are are administration entities for one or several websites and help organize them into categories. For example, you can have one account Business for your commercial projects and one Private for personal websites.
- Property: This is Google’s name for websites and web apps that are assigned to a Google Analytics account. One account can have 50 properties.
- Views: Properties can have 25 views each. Views determine the type of data that is accessible for that property. I’m not going into this part too much, but you should know about it nonetheless.
How you organize your accounts and properties is up to you. There is no wrong or right way. You can set up one account for each property or combine several properties in one account.
However, you should be aware that while you can always change the name of accounts and properties, you can’t move websites from one account to another without losing their data.
Ok, now back to opening your fresh account. We will assume that it is your first one and that you will only need one property for one website at this moment. So fill in the required information.
After that you can choose how much of your data you would like to share with Google. When you are done here, click on Get Tracking ID to proceed. Before you can move on, you have to agree to Google’s terms and conditions.
In the next part we will deal with how to get the tracking code onto your WordPress website. Only then can you start collecting data.
However, before that let’s quickly go over how you can add additional accounts and websites to Google Analytics at a later point.
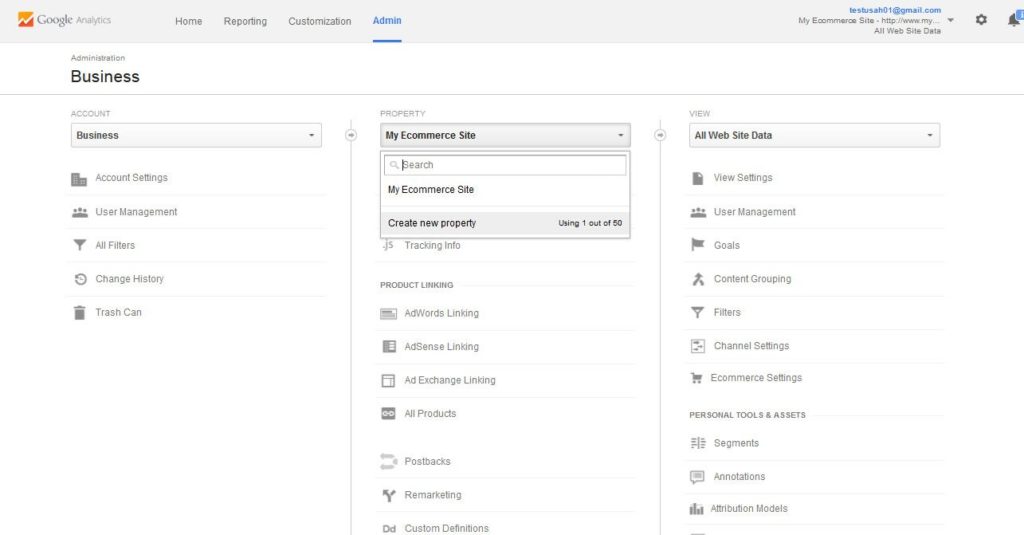
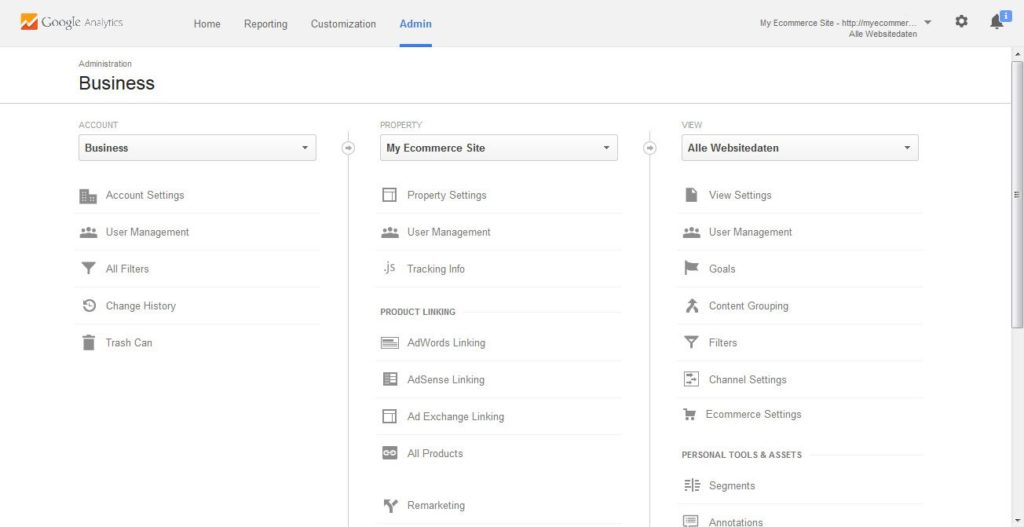
Click on the Admin tab at the top of the screen, which will take you to the main administration area.
Here you will find three columns: Account, Property, and View. Through the dropdown menus in the respective columns, you can access existing accounts and properties. You also have the option to create additional ones.
Easy, right? Good, then we can move on.
How To Install Google Analytics On Your WordPress Website
In the previous step we were left on the page that gives us our tracking code (Tracking Info > Tracking Code if you are still in the admin menu).
It’s a simple script that we now have to get onto our site. It needs to be present on every page that you want to track, which is usually all of them.
There are several ways to do so. One option is to do this manually by copying the code and pasting it into your header.php file right after the <body> tag and before the <head> section.
You can also use a snippet in functions.php such as the following one to add the tracking code to your site’s footer:
[php]<?php
add_action(‘wp_footer’, ‘include_googleanalytics’);
function include_googleanalytics() { ?>
// Paste tracking code here
<?php } ?>[/php]
Some themes (like the Genesis Framework) also offer special fields to input header or footer scripts.
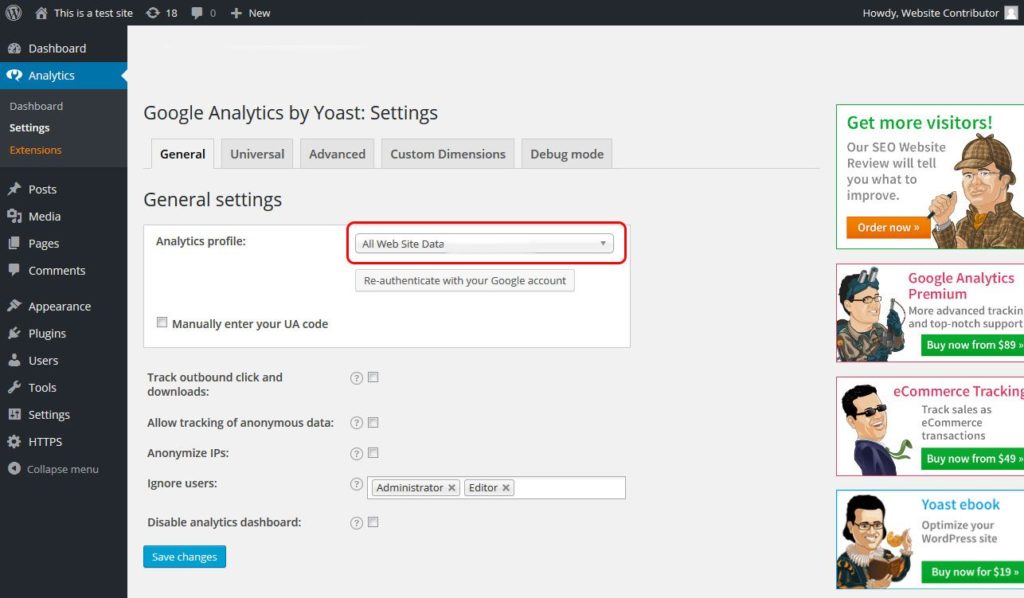
However, in my opinion, it’s most comfortable to go the plugin route, via Google Analytics by Yoast. After installing and activating the plugin it literally takes only seconds to set it up.
Go to Analytics > Settings in the newly-generated menu item and click Authenticate with your Google account.
In the next screen, click Allow to permit the Yoast plugin to access your Google profile. Be sure to be logged in with the correct one. Copy the code from Google, paste it in the highlighted field in WordPress, and save.
After that you can just pick the desired property you would like to track from the dropdown menu. Do so and save.
That’s it. Now you need to give Google 12-24 hours to collect data before you can view it
A Quick Tour Through Google Analytics
Now you can start digging into your data. Google’s web analytics offer a lot of options. The main sections can be found on the left hand side: Audience, Behavior, Acquisition, and Conversion. We will quickly go over what they contain.
Audience
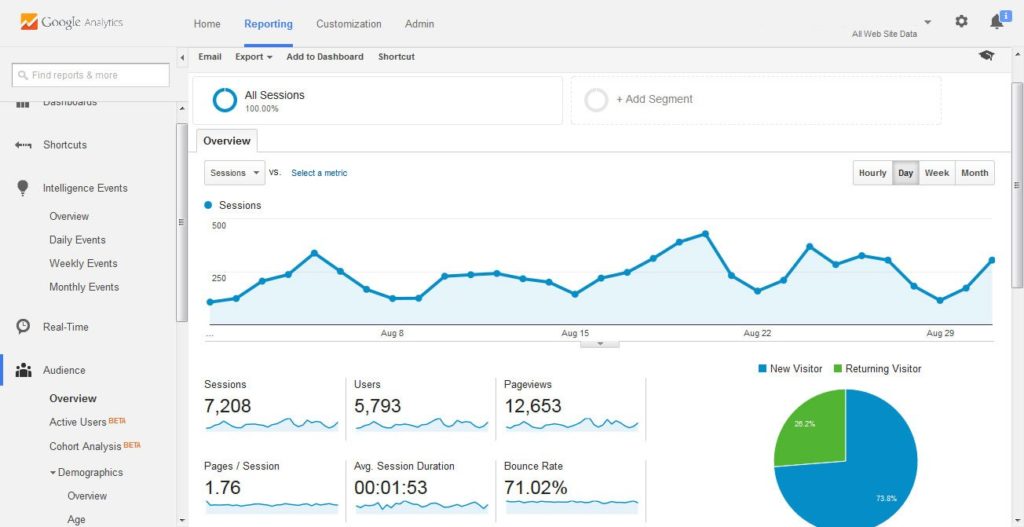
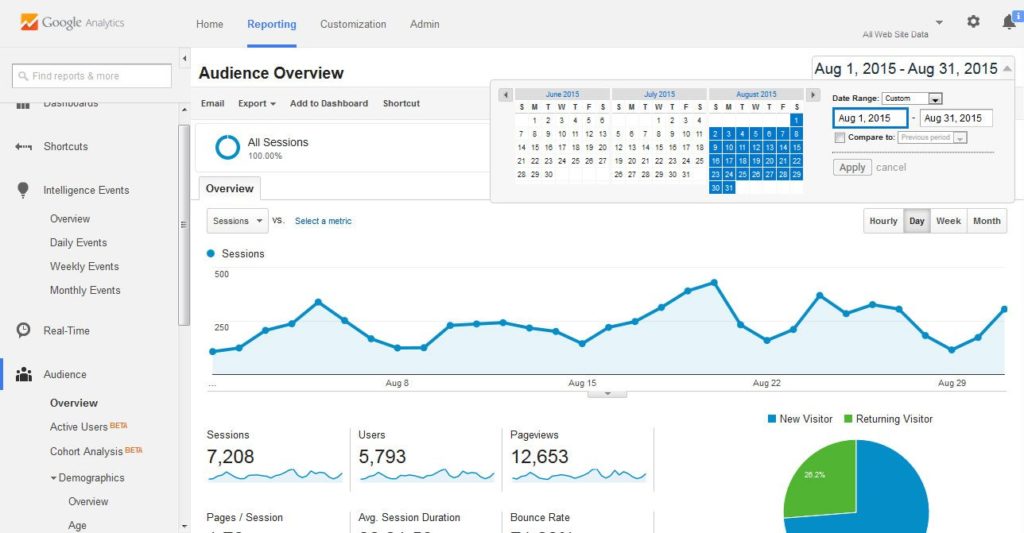
By default, when logging into your dashboard, you will be confronted with the Audience Overview. It is one of more than 50 reports available in Google Analytics.
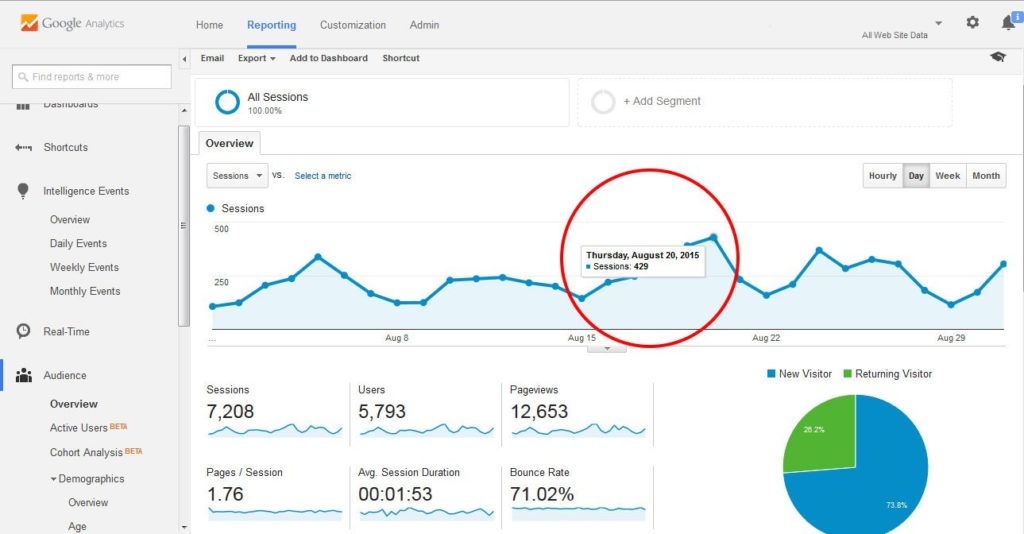
In the upper part you’ll see a graph that depicts last month’s traffic. When you hover over the line, it will give you more detailed information on the concrete numbers.
That is generally something to keep in mind for Google Analytics. In every screen you can click and hover over elements on the page (especially links and circles with question marks in them) to gain additional information.
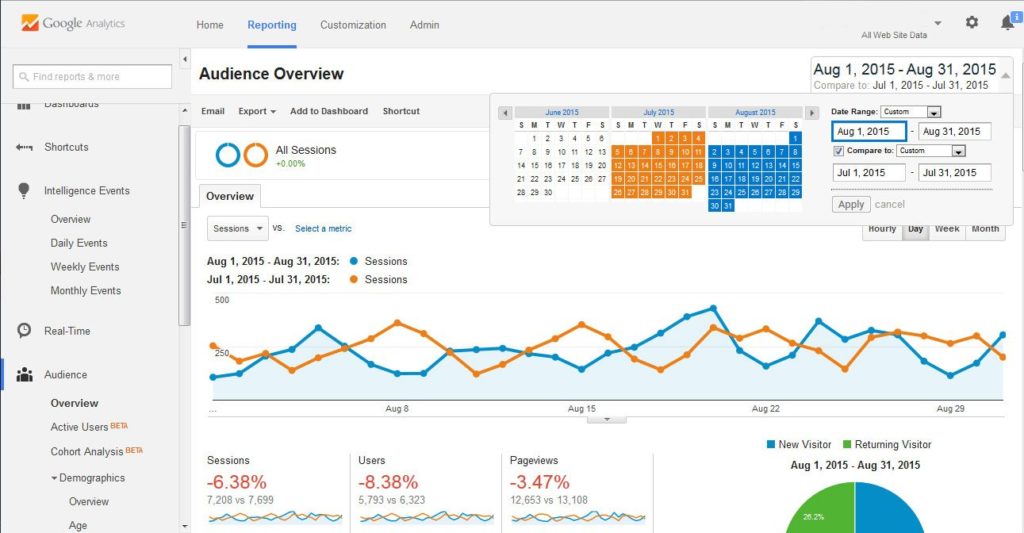
Further up on the right you can change the time frame for which you would like to see data via dropdown.
This is useful for example to see the amount of traffic that came in from an earlier guest post. You can also juxtapose data for different timelines via the compare box.
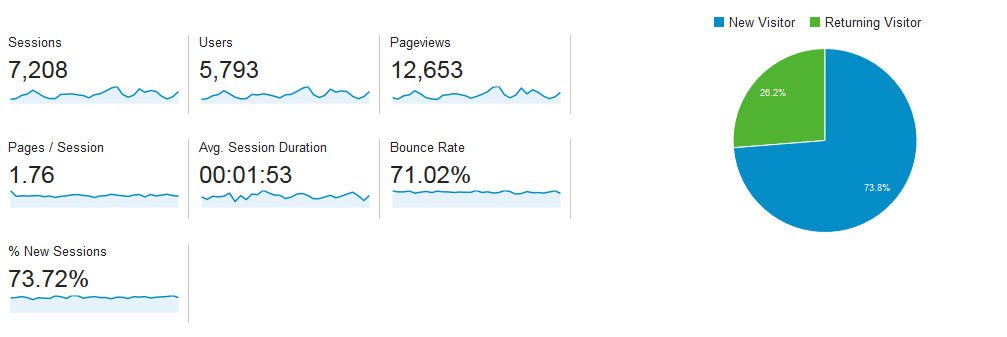
Below that, you’ll notice a number of important site metrics: number of visitors, unique visitors, pageviews, average pages per visit, average time spent on your site, bounce rate (percentage of visitors who left your site without accessing any other page than the one they landed on), and the ratio of new vs repeat visits.
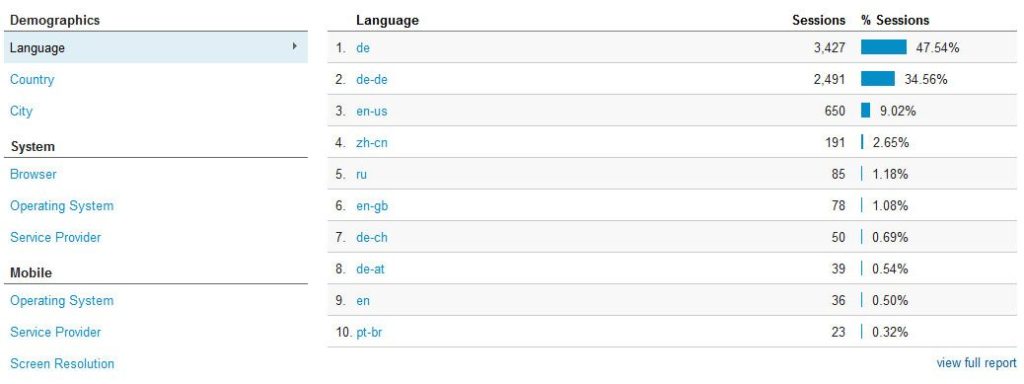
Further below are short reports on your audience’s top ten languages, countries, cities, browsers, operating systems, and more.
For each of these you can click on View full report or the links on the left for more details. This will take you to the submenu items of the audience section. You can also get there via the menu on the left.
Acquisition
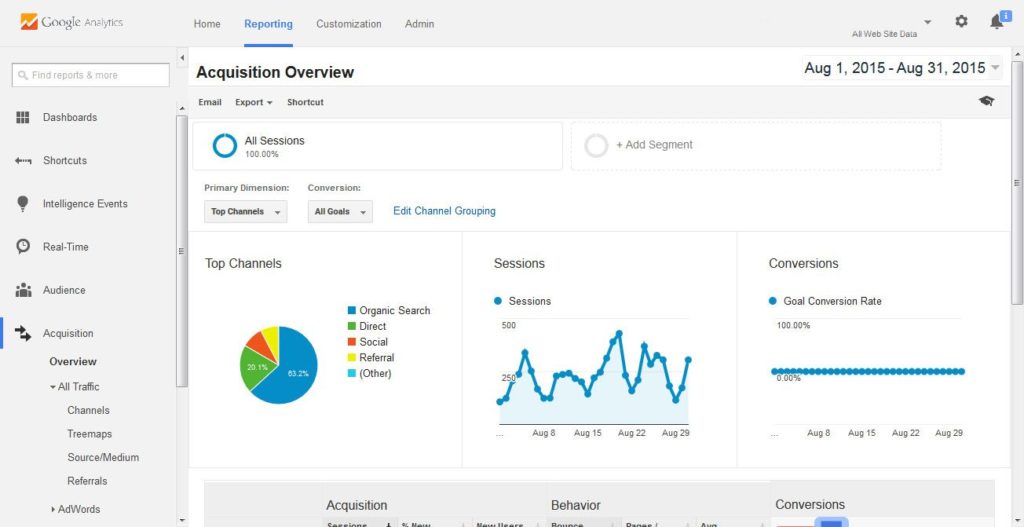
The Acquisition section is one of the most important parts of your web analytics.
It tells you where your traffic is coming from, the effectiveness of your marketing efforts (SEO, social media, PPC and more), as well as who is linking to you.
This report can thus help you identify weaknesses in your strategy and how to address them.
If you link your Analytics account to your Google Webmaster Tools, you can also get reports on the search queries Googlers are using to find your site under the Search Engine Optimization tab.
The Acquisition report will also tell you which pages your audience most lands on, which search engine and social networks are sending you the most visitors and what kind of traffic (organic, direct, paid, social, referral) rakes in the most views.
Behavior
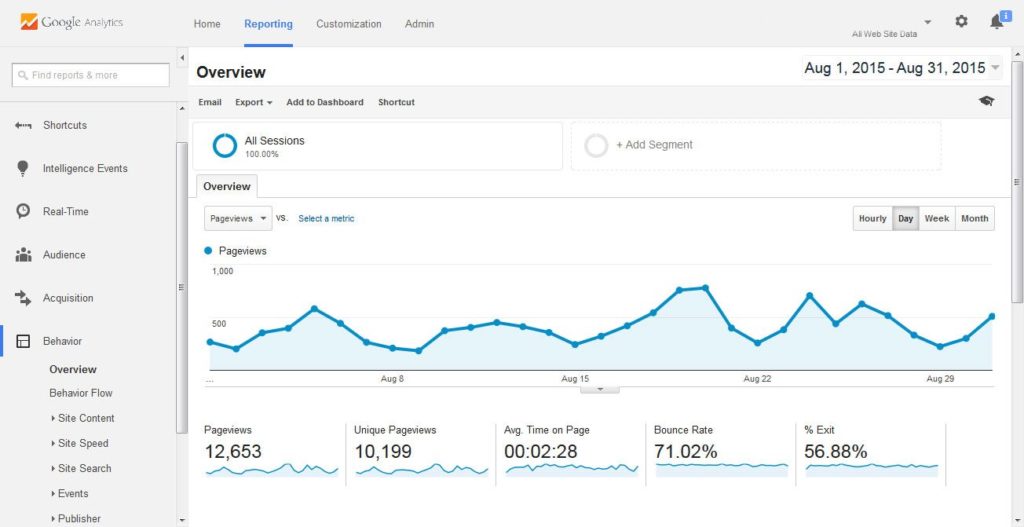
This part is all about gaging the quality and effectiveness of your content. The default view will tell you about pageviews rather than visits, which is why the numbers will (hopefully) be higher than under Audience.
You can also contrast this number with unique pageviews. The latter are only logged once per browsing session while the former also also counts it when a page is reloaded, the back button in the browser is used etc.
In addition to that, you can learn the average time users are spending on your site. The more engaging they find your content, the higher this number will be. Same goes for the bounce rate, only that here your goal is to keep the number as low as possible.
The Behavior section also allows you to view the search terms visitors are using to come to your site as well as which of your content is the most popular.
In addition to that you can learn about landing pages (where most visitors enter your site) and exit pages (where they leave it). This is crucial information to optimize these pages for visitor retention.
Another section that has become more important in recent years is that for site speed. It will give you a rough estimate of the time it takes for your site to load in different browsers.
Google Analytics will even give you suggestions how to increase your page load speed. For a more in-depth analysis, there are also other free tools.
If you enable site search (more on that below), you can check the section of the same name for search terms that visitors are inputting into the internal search on your site.
Conversions
Conversions is one of those magical Internet words that everyone is chasing.
In reality there isn’t too much magic to it. It basically means that you manage to get your users to do what you would like them to. Be it to sign up to a newsletter, make a purchase or fill in a form.
Google Analytics knows two categories of conversions: goals and ecommerce.
For the former you can create up to four sets of goals with five individual targets each. These can be of the following four types: Destination (audience visits a certain page), duration (certain time on page is reached), pages/screens per session and event (e.g. user played a video).
An example use case for this is to measure how many people reach a product page or thank you page after completing an order.
Worth measuring if you have a concrete objective you want your visitors to reach, such as the end of your sales funnel. Google Analytics will track the numbers for you.
Goal tracking for ecommerce is more complicated, but you can refer to the official documentation on that topic.
Intelligence Events
A relatively new feature are the Intelligence Events. These are alerts for changes in pageviews, average time on site, bounce rate and other markers.
This can be used to spot problems on your site, sudden traffic spikes and other events that might need your immediate attention and get alerted to them quickly. Just set your conditions, decide on a notification type, save and you’re done.
Creating Custom Reports
Last but not least, under Customization in the top navigation you can also set up your own custom reports. It provides you with filters based on the standard Google Analytics reports plus some custom ones for further segmentation.
Important First Steps
Now that you can find your way around the interface, it’s time to take some action. Here are a few important steps you can take immediately.
Enable Site Search
For websites that have a search form (so, pretty much every WordPress website), it’s a good idea to enable Site Search Tracking.
This means that Google Analytics will track the queries your visitors are typing into the search form. It is a great way to find out more about your users’ intent and what else they are looking for on your site.
To do so, you need to first run a search on your own site. The query isn’t important, just keep the tab open. You will need info from the URL soon.
In this case, I am using Torque as a example and I get this search URL
[code]https://torquemag.io/?s=wordpress[/code]
Then under Admin go to the View column and click on View Settings. Scroll down to Site search Tracking and switch it on.
Now you need to input the query parameter to enable it. That’s where the URL from before comes in. Look for a parameter that looks like “x=” (or “?x=” — both without quotation marks). The letter or term that you find in the position of x is the query parameter. In my example that’s simply s.
Share Your Analytics Data
Earlier I talked about how you should not be dependent on someone else’s Google Analytics account. However, that doesn’t mean you can’t share your data with someone else.
Yet, instead of sending them the credentials to your Google profile, you can add them to accounts, properties, and views under User Management in the respective column in the Admin screen.
All you need to do is input their email address, set the permission level and click add. It’s that simple.
Set Up Email Reports
In order to derive value from tracking your site’s data, you need to make sure you or a member of your team actually gets to see it. Otherwise it’s easily out of sight, out of mind.
A good option for that are automated email reports which you can set up in most of the reports by clicking on Email in the submenu at the top.
Set a frequency, day of the week, and recipient address and you will always stay up to date with your site’s life signals.
Summing Up
Having some sort of analytics solution present is important for any type of website. Without it, their owners and marketers will have to rely on trial and error to achieve success.
Google Analytics is among the favorite solutions out there due to its capabilities, the fact that it is free and also because the majority of us are trying to optimize our sites for the big G anyway.
Google’s web analytics provide invaluable information about who your audience is and how you can serve them. Though the sheer mass of data can be confusing in the beginning, it’s far from impossible to learn.
I hope this Google Analytics tutorial for beginners helped demistify the topic a little bit and you feel ready to implement Google Analytics on your own site. Now go and get tracking.
Do you use Google Analytics or some other solution? Any additional tips or thoughts? Please share in the comments.


6 Comments