Having problems arise on a website or even within the local installation of a website can be nerve-racking. After all, site performance issues or bugs can result in site downtime. And site downtime can mean lost traffic, missed opportunities, and even lost revenue.
Thankfully, numerous debugging solutions exist for identifying and repairing site issues. But how can you know what will work best for your situation?
In Local, there’s a multi-pronged approach available for debugging. Here, we’ll be discussing the default debug options included with Local, as well as ways to identify errors, and additional add-ons you can use for spotting and fixing problems more quickly and efficiently.
What is Xdebug in Local?
Before we can discuss how to debug in Local, we need to first talk about Xdebug, the debugging tool present in Local and some of its most noteworthy features.
Xdebug is actually a PHP extension that simplifies the debugging process. Primarily, it makes the formatting for the var_dump () function cleaner and adds on more warnings and notices about specific errors. That way, it makes for a more intuitive user experience.
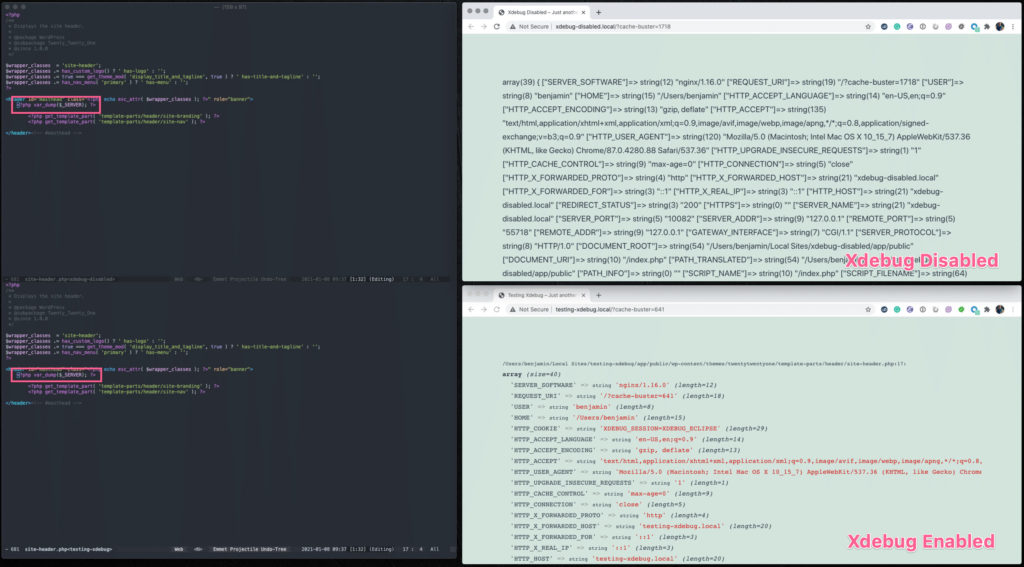
In case you don’t know, var_dump() is a useful bit of PHP that quickly reveals what’s wrong with your code. But the distinction here is that if you didn’t have Xdebug on hand, the code produced when you call var_dump() would be much harder to read. Plus, you’d have to format your PHP in a very particular way when even calling var_dump() in the first place.
Xdebug is available in Local because it offers a greater depth of information about errors when they arise. It also comes with a step debugger that streamlines the debugging process, especially for larger problems. The step debugger works by allowing you to evaluate your code step-by-step at specific breakpoints. This allows you to assess the code in smaller sections and to locate issues more readily.
And the best part is Xdebug is enabled in Local by default, so you don’t even have to mess with any settings to get started. Just open Local and go.
How to Debug a Website in Local
You can debug a website in Local in a few key ways. Here are the primary steps we’ll be discussing:
- Identifying browser console errors
- Using Query Monitor
- Via Xdebug and VS Code
- With Xdebug and PhpStorm
- Using Xdebug for step debugging
Let’s dive in.
1. Identify Browser Console Errors
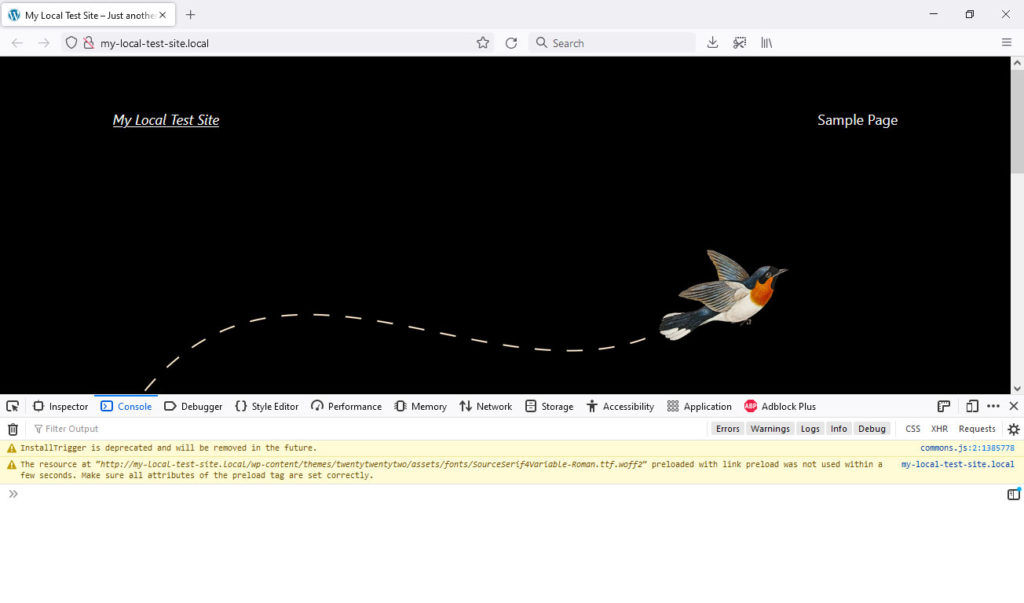
The first step in debugging is using the browser console, which is part of all browser developer tools. This allows you to spot errors on web pages without any special tools. Simply start Local, access the page in question with the browser of your choice and use the console to spot errors. What follows is a breakdown of how to access the browser console across multiple browsers.
If You’re Using Chrome…
- Open DevTools by going to More Tools > Developer Tools while in the Chrome browser menu. Alternatively, hit Ctrl/Cmd+Shift+I.
- Click the Console tab.
- If there are any errors present, they should be visible now. If not, reload the web page to generate them.
- Make note of the type of error, where it’s located, and its line number within the browser console.
If You’re Using Firefox…
- Open the browser developer tools by going to More Tools > Web Developer Tools while in the Firefox menu. Ctrl/Cmd+Shift+I works here as well.
- Click the Console tab. Alternatively, you can also access the console directly via More Tools > Browser Console.
- Any errors should now be visible. If not, reload the page.
If You’re Using Safari…
- Turn on Developer Tools by going to Preferences > Advanced while in the Safari menu. Option+Cmd+I is your friend here.
- Check the box next to Show Develop menu in menu bar. Then, close the dialog box.
- Click Develop > Show Error Console. Same deal as above.
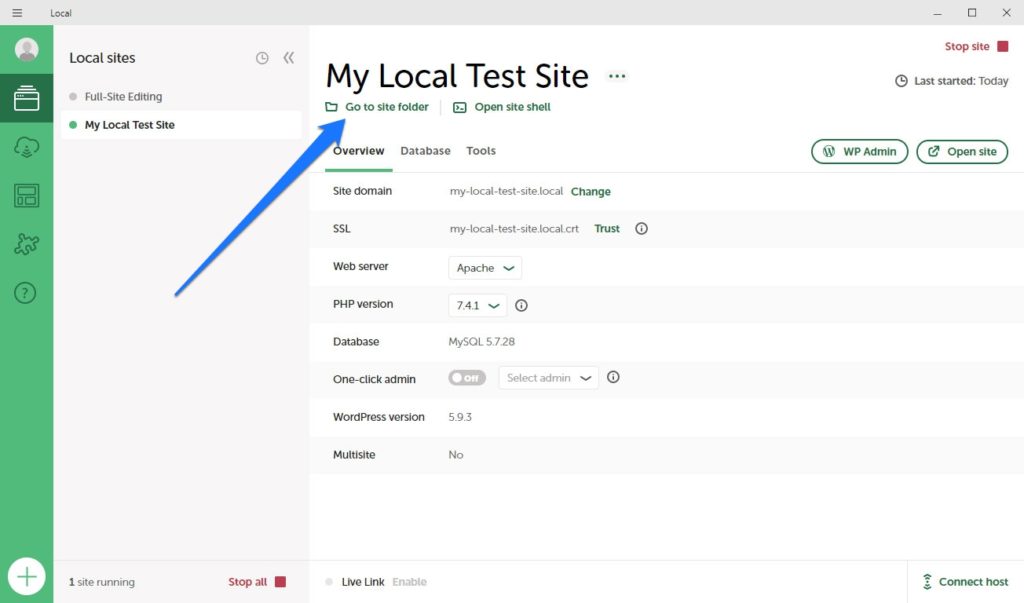
Armed with this information, you can go back to the file system set up in Local and find the specific bit of code causing the issues and then implement a fix. Use the Go to site folder button to access the location of your local websites.
2. Use Query Monitor to Fix Site Performance Issues
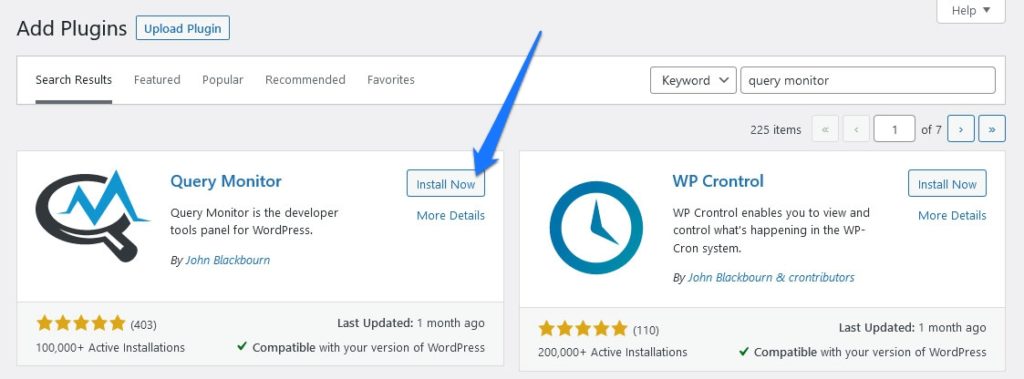
You can identify and repair website issues directly in WordPress, too. In fact, the Query Monitor plugin is a fantastic choice for debugging and for identifying performance issues, specifically. This makes for a helpful pair with built-in Local debugging tools and is especially helpful for spotting third-party plugin and theme issues.
You can install the plugin like any other. Simply go to Plugins > Add New and search for it by name. Find it in the list and click Install Now, then Activate once it has been downloaded.
What Query Monitor Can Tell You
After installing the plugin, you should see a new menu option at the top of the WordPress dashboard.
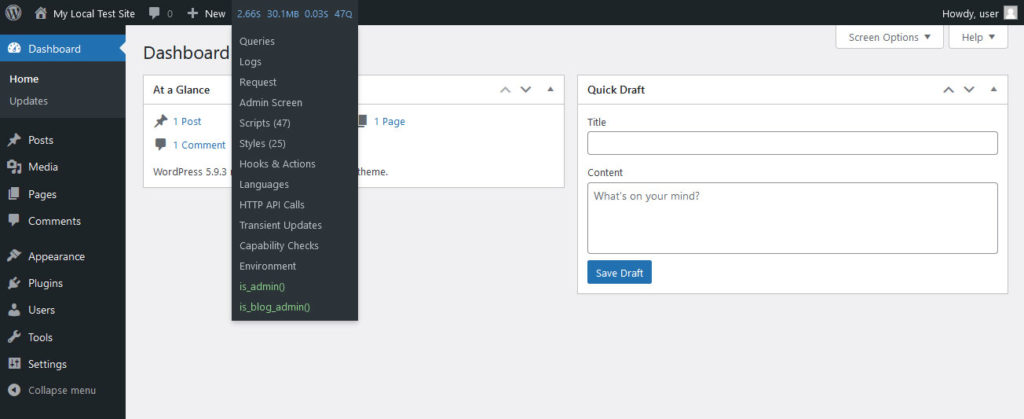
Hovering over it will reveal a drop-down list of Query Monitor tools and options. Picking any of them will open up a menu at the bottom where you can learn more details about the current page.
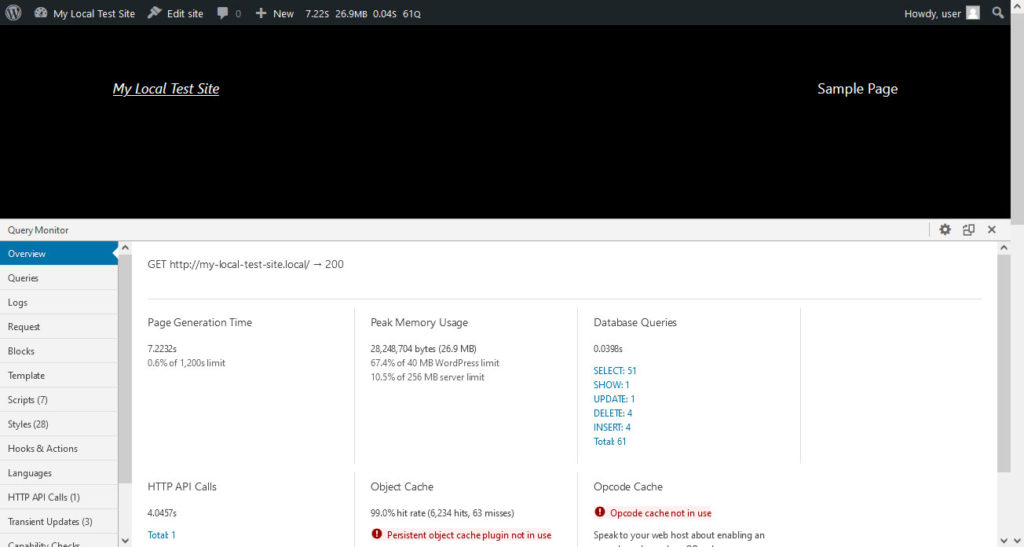
Among other things, Query Monitor will give you an overview of your page’s performance, including:
- Peak Memory Usage. This tool shows you how much memory is used to generate a page at a given time.
- Page Generation Time. Shows you the amount of time it takes for a page to generate.
- Database Query Time. Lastly, this tool shows you how long it took the database to respond to theme or plugin requests.
Beyond performance issues, this plugin can also identify PHP errors and notices – much like Xdebug does. However, its efforts focus on third-party themes and plugins. What’s convenient here is that if errors are present, a new tab will appear within the tool aptly named PHP Errors that will list each error with its security threat. It will also tell you the line of code where the error appears and the specific error code or notice as well.
Now this is really helpful for websites that are already live or in late-stage testing. However, if you’re still in the local development stage, using Xdebug in Local is going to be your best bet.
3. Setting Up Xdebug and VS Code for Debugging
Back in Local, you can make use of Xdebug in a variety of ways to perform local site debugging. To get more bang for your buck, so to speak, you can add the power of VS Code to the equation.
VS Code is an open-source code editor with expanded tools and a more intuitive user interface. It makes that line-by-line debugging process a lot more intuitive and easy on the eyes.
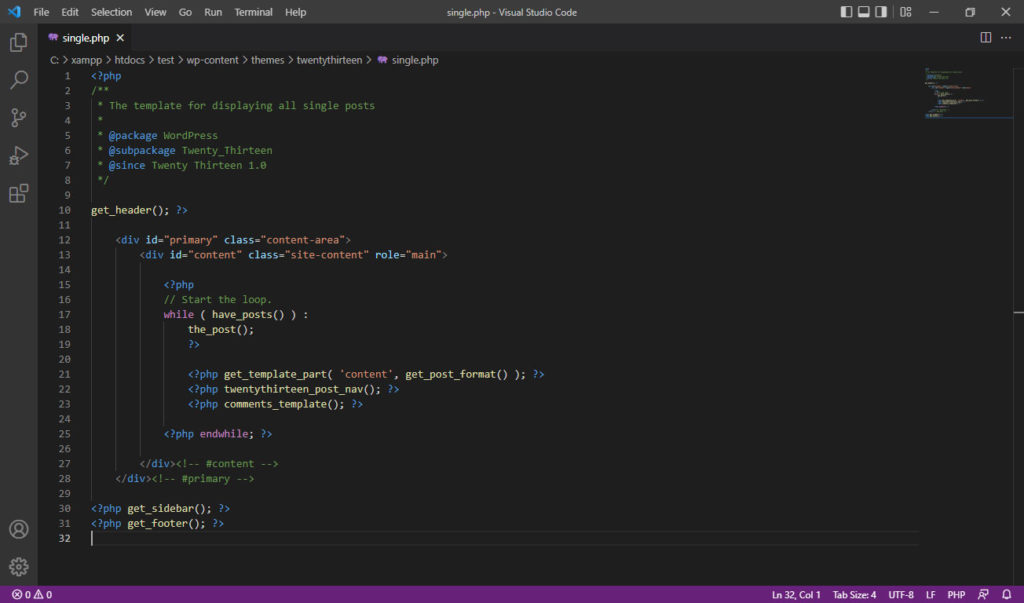
You can actually connect VS Code to the Xdebug Step Debugger to great effect. Here’s how to set it up for use inside Local:
- Download VS Code and install it per the developer’s instructions.
- Download and install a PHP debugger extension. Local’s documentation recommends the PHP Debug extension for this task.
- In Local, click Add-ons > Xdebug + VS Code.
- Click Install Add-on.
- Once done, hit Enable & Relaunch.
- Open a site in Local and then click the Utilities tab.
- Click Add Run Configuration to VS Code.
- VS Code will launch and you can then start the debugging process.
If you don’t prefer VS Code, you can use another editing tool for the task.
4. Setting Up Xdebug and PhpStorm for Debugging
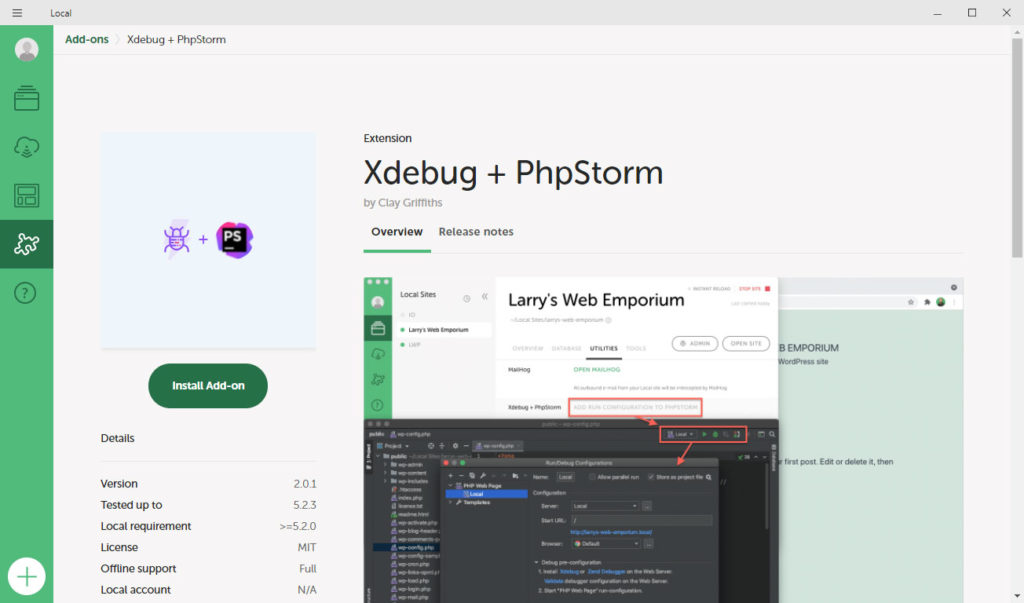
Another option is to use PhpStorm with Xdebug. You can add it to Local via add-on and it’ll work in conjunction with the Xdebug Step Debugger. Installation and setup is very similar to the process described for VS Code above. To use it, perform the following steps:
- Download and Install PhpStorm.
- In Local, click Add-ons > Xdebug + PhpStorm.
- Click Install Add-on.
- Again, Enable & Relaunch after it’s done.
- Open any site in Local and click the Utilities tab.
- Click Add Run Configuration to PhpStorm.
- With PhpStorm active, set breakpoints by clicking the gutter at the specific line of code where you’d like the breakpoint to occur.
- Click Play to start the debugging process.
If you want more guidance through the debugging process, Step Debugging is always an option.
5. Using Xdebug for Step Debugging
Step Debugging is a super useful tool and part of Xdebug that essentially holds your hand through the debugging process. It works with VS Code and PhpStorm (as well as many other IDEs and text editors) to provide detailed yet easy to follow debugging tools, steps, and protocols.
In Local, you don’t have to do anything to set up Xdebug – it’s enabled by default automatically. Though there are more complex setup instructions if you have a complicated testing environment (with multiple systems contributing at once), we’re going to assume it’s just you needing to perform the debugging, on one system, in one installation of Local for now.
To use step debugging, all you actually need to do is follow the steps outlined in the previous two sections. The feature works with both VS Code or PhpStorm. Once everything is set up, it will automatically set breakpoints and play through the code one by one. This offers an intuitive way to run your code, see the errors, and fix them as they arise.
Debugging in Local Made Easy
As you can see, debugging in Local is actually a pretty easy process that requires minimal set up to get started. The primary debugging tool is already present by default. All you need to do is set up your preferred text editor or IDE, configure an add-on or two, and you’re all set. Of course, you will need to perform the actual bug fixes to get your website in tip-top shape. But at least, the debugging process itself can be executed with ease and minimal fuss.
What are your preferred tools to debug in Local? We’d love to hear your feedback in the comments below.

No Comments